Analytics Tab
The Analytics tab shows key performance metrics for the selected device in your account. This is similar to the Dashboard Fleet Analysis, but it focuses solely on the specific device, providing easy access to insights for the selected device on the map page.
To navigate, go to the 'Maps page', select a device you want to check the analytics, and there will appear a new panel on the right side. Finally, click ‘Analytics tab’, and you can now see the key performance metrics for the selected device.
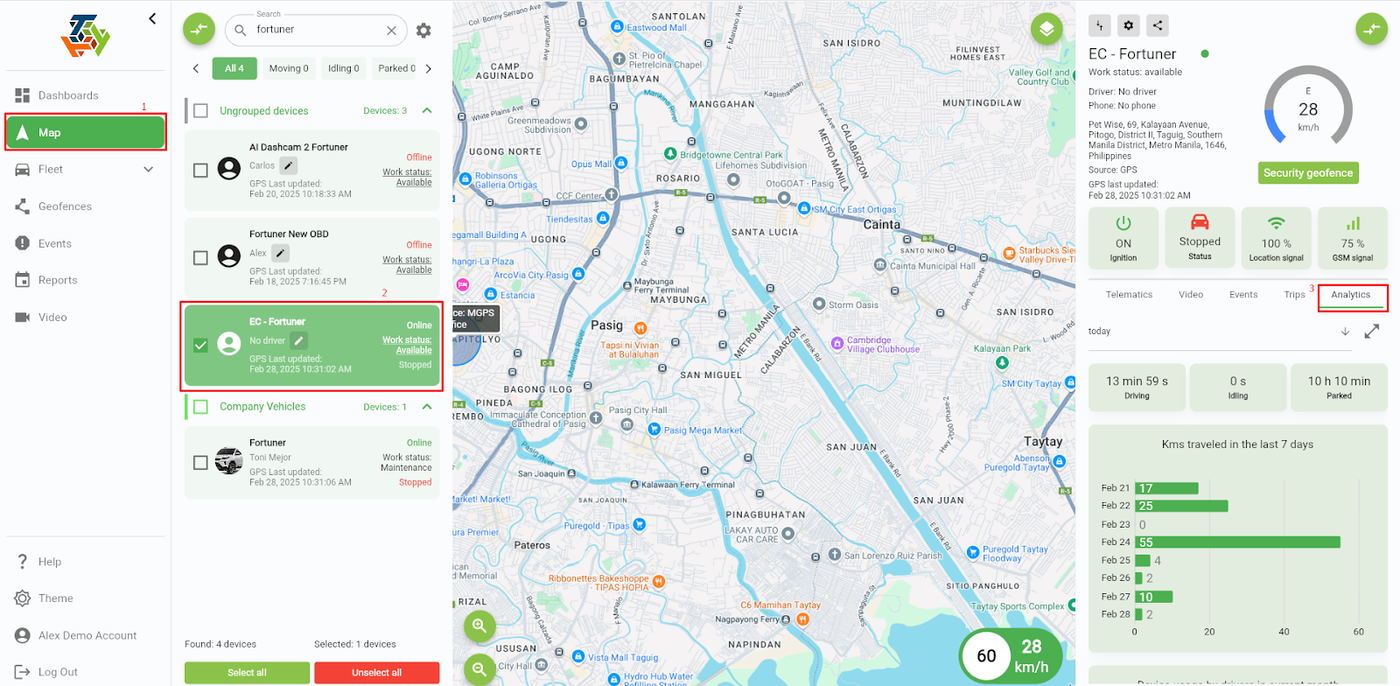
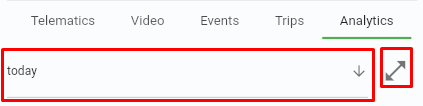
The default time period is set to the current day, but you can adjust it as needed. The icon on the right side is for fullscreen mode, allowing you to view the information more clearly.
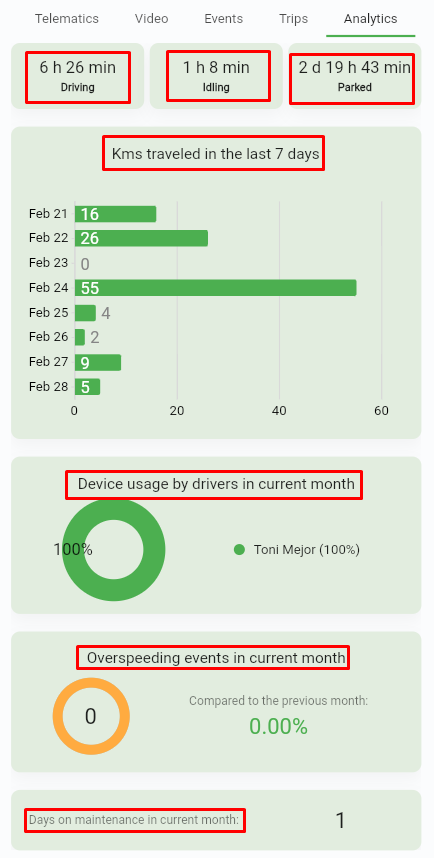
Driving - total driving time by the selected device.
Idling - total time spent on idling by the selected device.
Parked - total time the selected device was parked.
Kms traveled in the last 7 days - gives you an overview of the total distance covered by the vehicle in the past week, an easy way to track recent usage.
Device usage by drivers - this shows the percentage of driver usage for the current month, providing a breakdown of how frequently each driver has operated the vehicle throughout the month. It helps you monitor shifts, and gain insights into which drivers are using the vehicle the most.
Overspeeding events - provides you an insight of overspeeding events that occurred in the current month, displayed as a percentage. This helps in monitoring how frequent the overspeeding happens for the specific vehicle.
Days on maintenance - this displays the number of times the vehicle underwent maintenance during the current month. Tracking this helps you ensure that the vehicle stays in optimal condition.
END OF DOCUMENT