System Status
The System Status section provides an overview of the entire system's health. It indicates whether the server is operational or if there are any issues. If the status shows ‘down’ or a decline in performance, certain features of the platform may be temporarily unavailable, such as platform access, device updates, and video features.
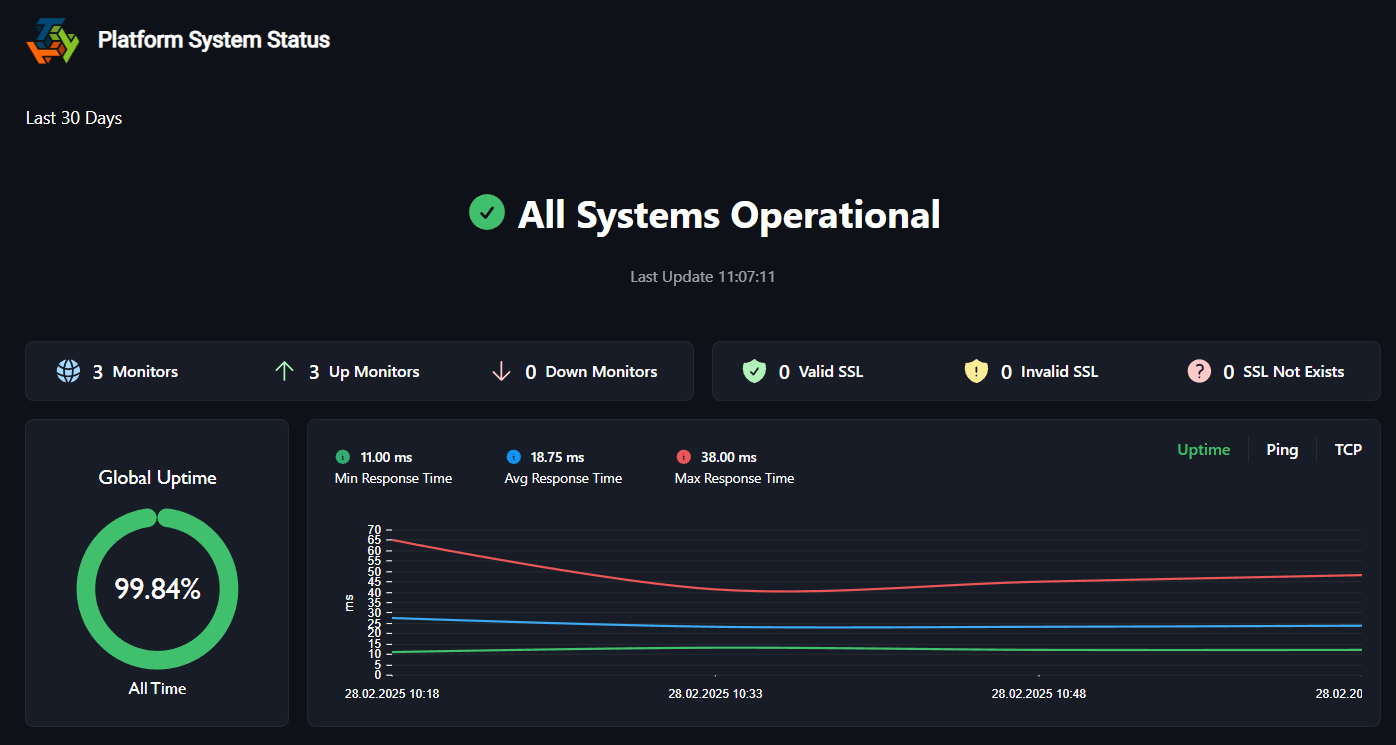
The graph displays multiple data series, each corresponding to one of the metrics (uptime, ping, and TCP). Each of these lines shows how the response times for those metrics changed over time. Lower values indicate faster responses, while higher values represent slower responses. While the percentage graph on the left displays the overall status of the system.
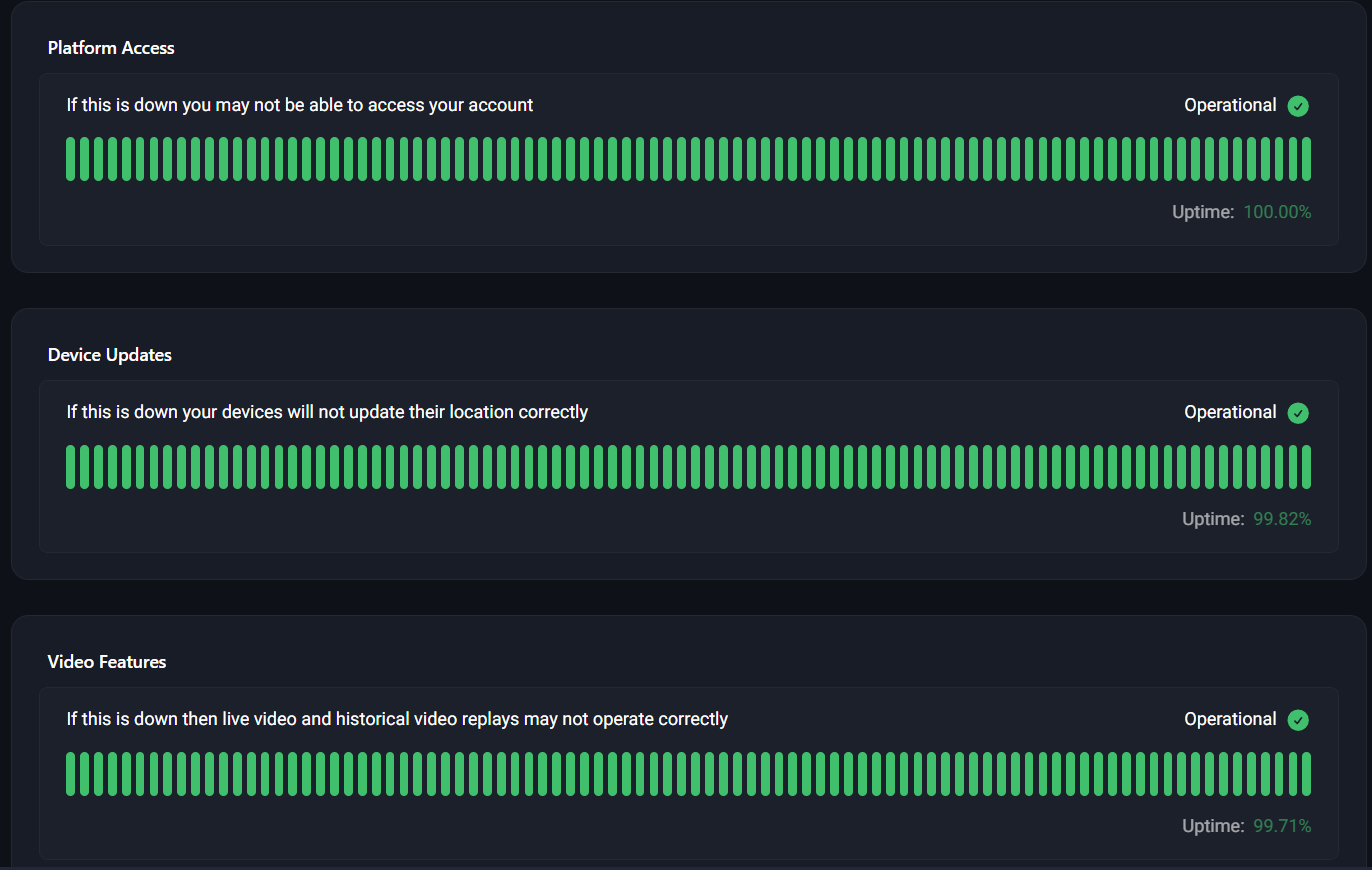
The graph should ideally show green, indicating that uptime is nearly 100% and the system is fully operational. If the graph deviates from this, as shown, there may be issues affecting each metric, which could result in performance disruptions, or simply being unable to perform certain actions, such as accessing the platform, updating devices, or using video features.
END OF DOCUMENT